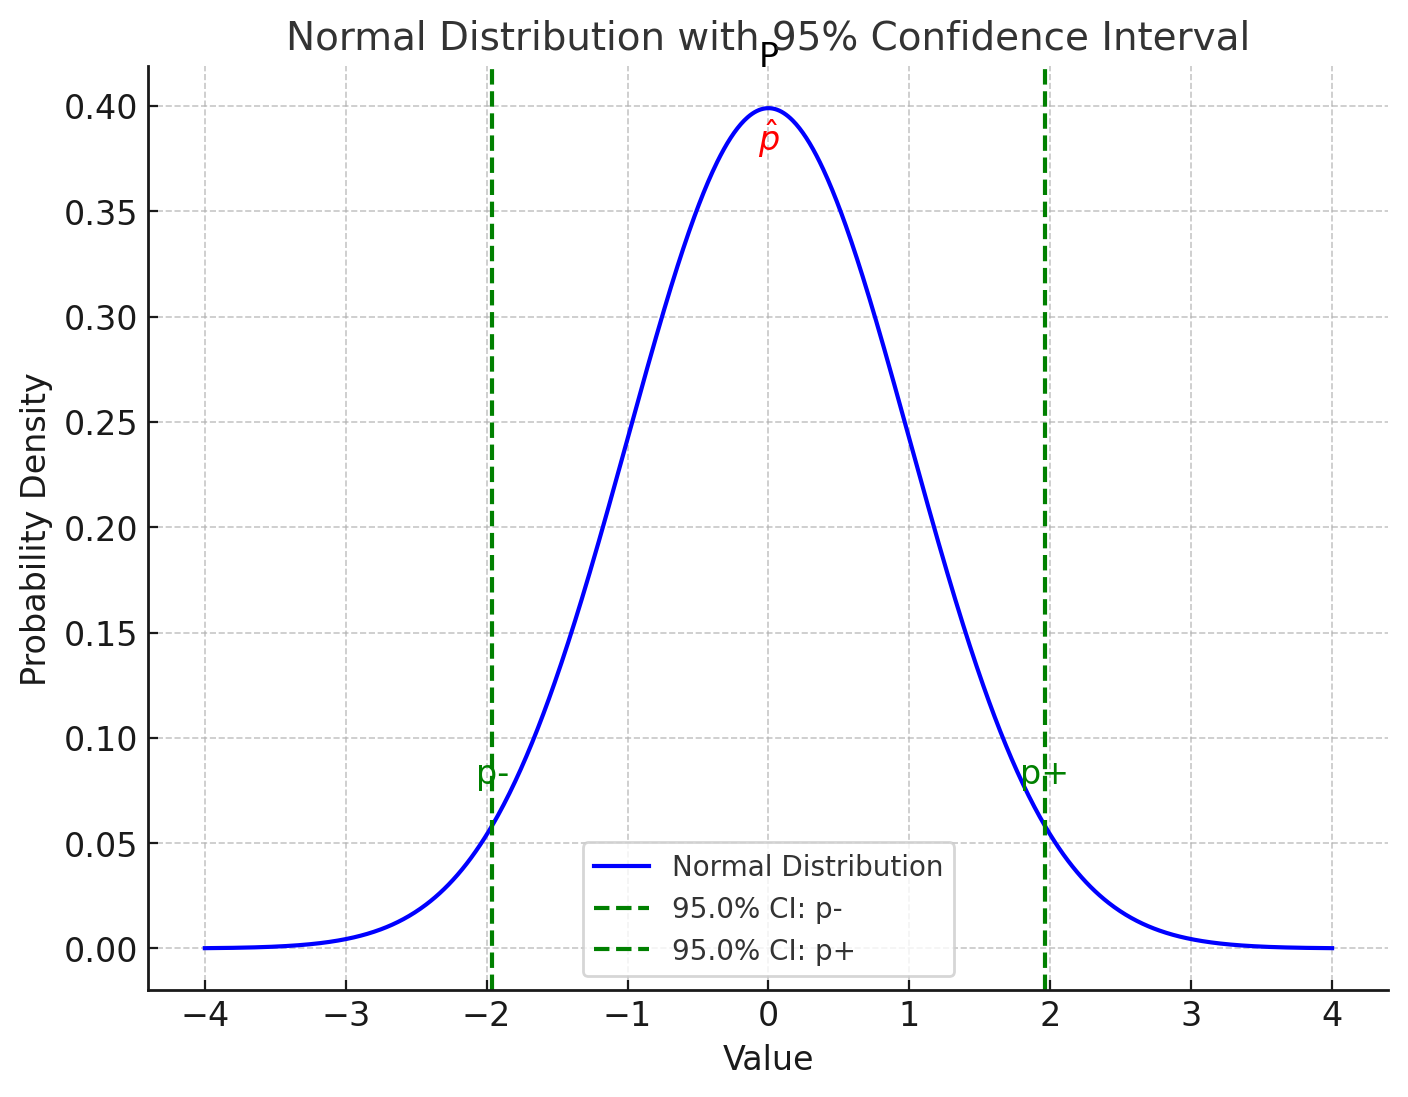
import numpy as np
import matplotlib.pyplot as plt
from scipy.stats import norm

# Create the figure and axis
fig, ax = plt.subplots(figsize=(8,6))

# Generate data for a normal distribution
mu = 0  # mean
sigma = 1  # standard deviation
x = np.linspace(mu - 4*sigma, mu + 4*sigma, 1000)
y = norm.pdf(x, mu, sigma)

# Plot the normal distribution
ax.plot(x, y, label='Normal Distribution', color='blue')

# 95% confidence interval
ci = 0.95
z_value = norm.ppf((1 + ci) / 2)
p_minus = mu - z_value * sigma
p_plus = mu + z_value * sigma

# Plot the vertical lines for the CI
ax.axvline(p_minus, color='green', linestyle='--', label=f'{ci*100}% CI: p-')
ax.axvline(p_plus, color='green', linestyle='--', label=f'{ci*100}% CI: p+')

# Mark the center (mean) with "P"
ax.text(mu, norm.pdf(mu, mu, sigma) + 0.02, 'P', ha='center', fontsize=12, color='black')

# Mark the CI endpoints with "p+" and "p-"
ax.text(p_plus, norm.pdf(p_plus, mu, sigma) + 0.02, 'p+', ha='center', fontsize=12, color='green')
ax.text(p_minus, norm.pdf(p_minus, mu, sigma) + 0.02, 'p-', ha='center', fontsize=12, color='green')

# Label p-hat near the confidence interval edges
p_hat = (p_plus + p_minus) / 2
ax.text(p_hat, norm.pdf(p_hat, mu, sigma) - 0.02, r'$\hat{p}$', ha='center', fontsize=12, color='red')

# Add labels and title
ax.set_title('Normal Distribution with 95% Confidence Interval', fontsize=14)
ax.set_xlabel('Value', fontsize=12)
ax.set_ylabel('Probability Density', fontsize=12)

# Show the plot
plt.legend()
plt.grid(True)
plt.show()
