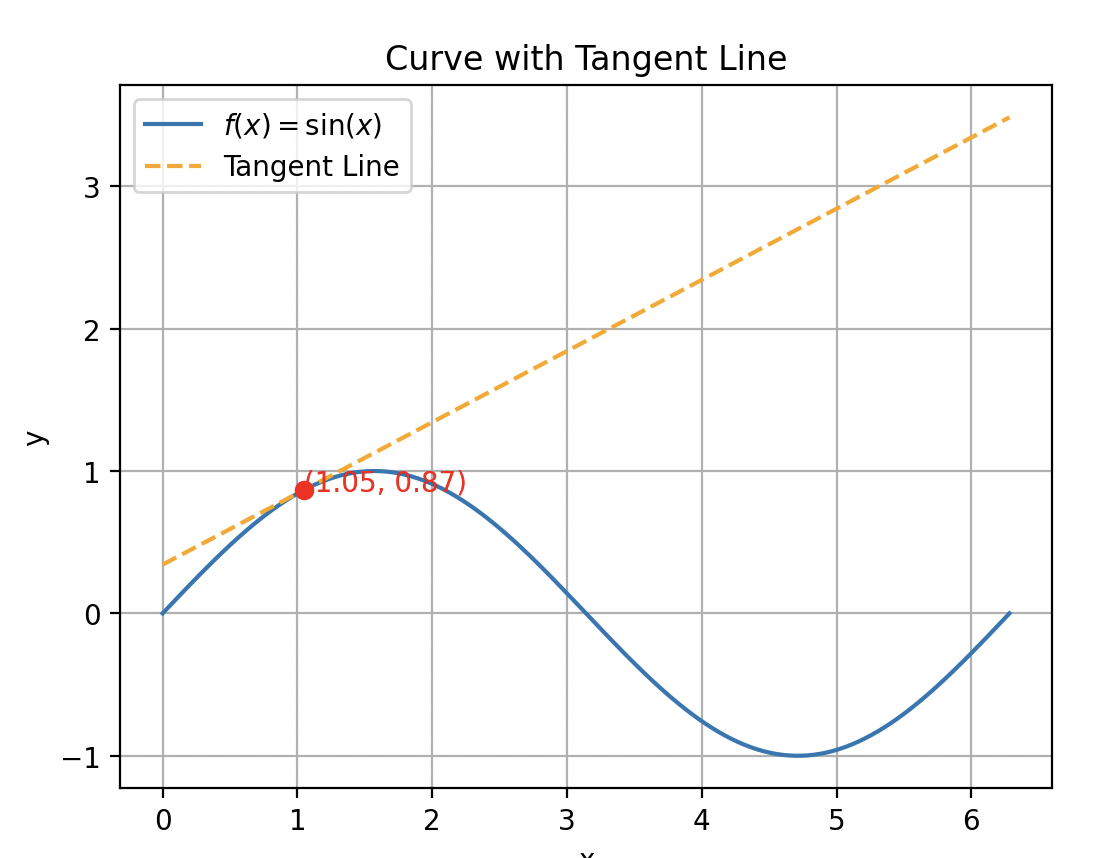
Recall how we can approximate a curve with a tangent line.
python graph
import micropip
await micropip.install("numpy")
await micropip.install("matplotlib")
import numpy as np
import matplotlib.pyplot as plt


# Define the function for the curve (y = f(x))
def f(x):
    return np.sin(x)


# Derivative of the function (f'(x)) for the slope of the tangent line
def f_prime(x):
    return np.cos(x)


# Define the x values and the point where the tangent will be drawn
x = np.linspace(0, 2 * np.pi, 400)
y = f(x)
x_tangent = np.pi / 3  # Point of tangency
y_tangent = f(x_tangent)

# Define the tangent line equation: y_tangent + f'(x_tangent) * (x - x_tangent)
tangent_line = y_tangent + f_prime(x_tangent) * (x - x_tangent)

# Plot the curve
plt.plot(x, y, label=r"$f(x) = \sin(x)$")

# Plot the tangent line
plt.plot(x, tangent_line, "--", label="Tangent Line", color="orange")

# Highlight the point of tangency
plt.scatter([x_tangent], [y_tangent], color="red", zorder=5)
plt.text(x_tangent, y_tangent, f"({x_tangent:.2f}, {y_tangent:.2f})", color="red")

# Add labels and title
plt.title("Curve with Tangent Line")
plt.xlabel("x")
plt.ylabel("y")
plt.legend()
plt.grid(True)

# Show the plot
plt.show()
This applies the same in the 3D dimension.
Tangent Planes in 3d
Info
Tangent Plane should include every tangent line to the surface at
Representing tangent planes in 3d is very similar, except the tangent plane will be just that, a plane that represents the curvature at one exact point on the given plane.
python graph
import micropip
await micropip.install("numpy")
await micropip.install("matplotlib")

import numpy as np
import matplotlib.pyplot as plt
from mpl_toolkits.mplot3d import Axes3D


# Define the function for the surface (z = f(x, y))
def f(x, y):
    return np.sin(np.sqrt(x**2 + y**2))


# Partial derivatives of the surface for the tangent plane
def df_dx(x, y):
    r = np.sqrt(x**2 + y**2)
    return x * np.cos(r) / r if r != 0 else 0


def df_dy(x, y):
    r = np.sqrt(x**2 + y**2)
    return y * np.cos(r) / r if r != 0 else 0


# Generate meshgrid for the surface plot
x = np.linspace(-5, 5, 400)
y = np.linspace(-5, 5, 400)
X, Y = np.meshgrid(x, y)
Z = f(X, Y)

# Define the point of tangency
x_tangent, y_tangent = 2, 2
z_tangent = f(x_tangent, y_tangent)

# Compute the tangent line (or tangent plane in 3D)
dfdx = df_dx(x_tangent, y_tangent)
dfdy = df_dy(x_tangent, y_tangent)

# Define the tangent plane: z = z_tangent + dfdx * (x - x_tangent) + dfdy * (y - y_tangent)
tangent_plane = z_tangent + dfdx * (X - x_tangent) + dfdy * (Y - y_tangent)

# Create the plot
fig = plt.figure()
ax = fig.add_subplot(111, projection="3d")

# Plot the surface
ax.plot_surface(X, Y, Z, cmap="viridis", alpha=0.8, rstride=100, cstride=100)

# Plot the tangent plane at the point of tangency
ax.plot_surface(X, Y, tangent_plane, color="orange", alpha=0.5)

# Highlight the point of tangency
ax.scatter([x_tangent], [y_tangent], [z_tangent], color="red", s=50)
ax.text(
    x_tangent,
    y_tangent,
    z_tangent,
    f"({x_tangent}, {y_tangent}, {z_tangent:.2f})",
    color="red",
)

# Set labels and title
ax.set_title("3D Surface with Tangent Plane")
ax.set_xlabel("X")
ax.set_ylabel("Y")
ax.set_zlabel("Z")

plt.show()
Finding the Tangent Plane for a given Equation
To find the tangent plane, we need a few things:
- The equation of the surface
- ex
- The point of tangency
- ex
Once you have these, you can find the tangent plane by following these steps:
- Find by plugging in the point of tangency into the surface equation.
- Find the partial derivatives of the surface equation.
For f(x):
For f(y):
- Plug in the point of tangency and the partial derivatives into the equation of the tangent plane.