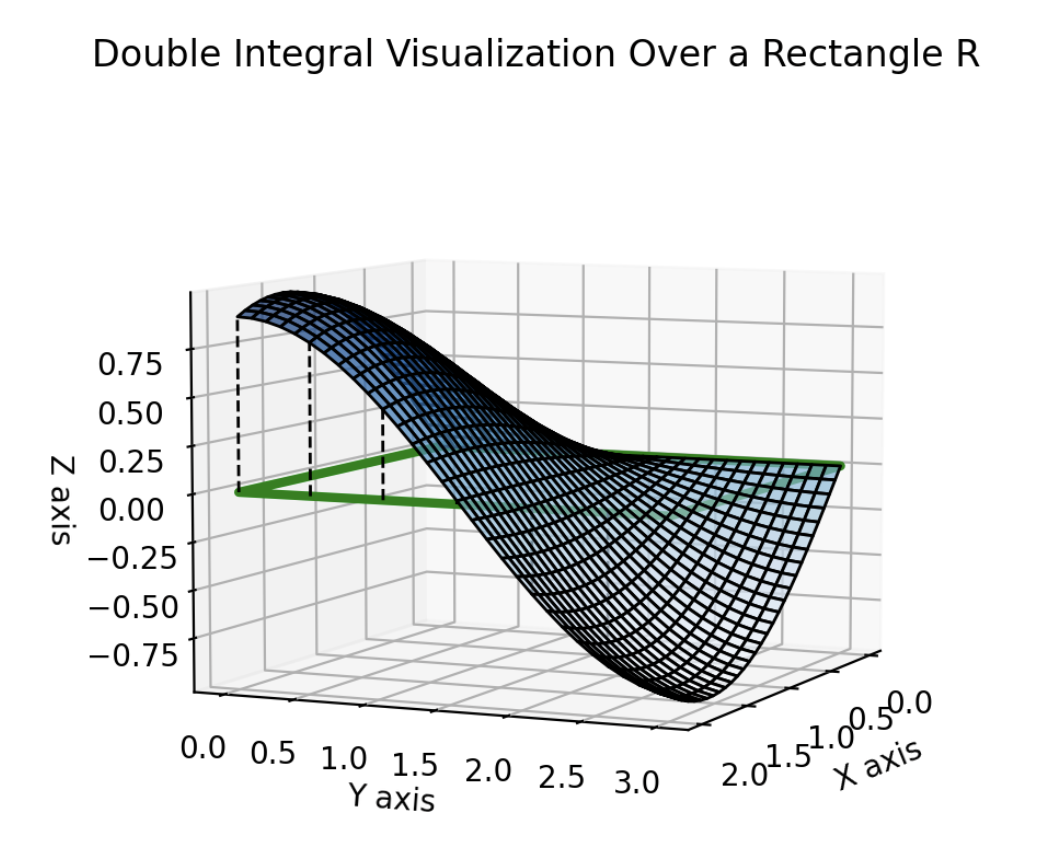
Consider the function defined over the closed rectangle
(The “x” in this context is called the Cartesian Product)
Graphing and Dividing
Suppose that for all
MatPlotLib Graph

Goal
Find the volume of the solid beneath
Sand aboveR
We proceed by dividing R into subrectangles.
Stencil
Subdivision of R with
m=5andn=4This is called the “Stencil”
Where a point like can sit somewhere in the subrectangle
If we choose a sample point in each subrectangle , we can approximate the volume beneath S and above by the rectangular prism with base and height .
If we call the area of , then the volume of the rectangular “box” is
Total Volume Approximation
We can approximate the total volume by summing the volumes of all the boxes represented in the stencil.
The “double-sum” means
Start at , then sum through all the j’s. Then step up to and sum through all the j’s. Repeat through . So, for the Stencil, we get
Note
We use as a shorthand to illustrate how the double-sum captures all elements in the stencil
Intuitively, the estimation of the true volume will improve as the number of subrectangles increases, and we define
We define the Double Integral as this sum
Definition
Where the Double Rienmann Sum is
This definition has some symbols we have not seen before, so let’s take a second to learn them.
Familiarizing Ourselves With Reading Integration Symbols
- describes the region of integration
- is the area element, meaning the area of the base of each “box” in the sum in the limit
- So, we think of the double integral as
The presence of two integral signs indicates the dimension of the integration region.
i.e. is a 2D-Rectangle
Remark
This particular double integral can be interpreted as “signed volume”
Examples
Example
Estimate the volume of the solid that lies above the rectangle
and below the elliptic parabaloid
Solution
The idea here is to approximate
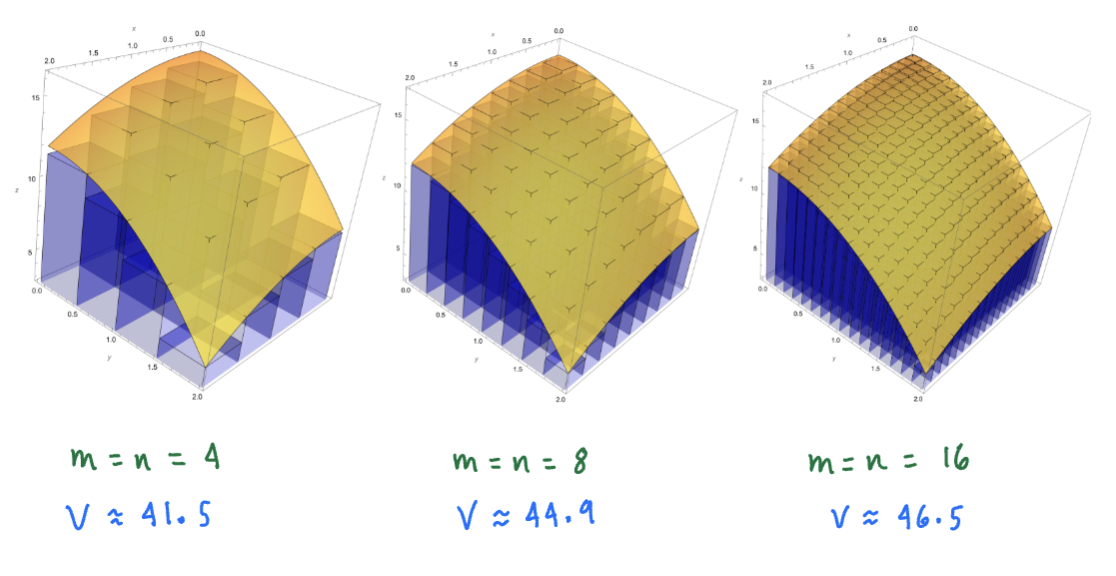
We can do this by evalutating the double-Rienmann sum for increasing values of and . This is a brutal calculation by hand, so we will use Mathematica to calculate and illustrate the sum.
Sketch
As we can see, the approximation to the true volume improves as the number of boxes increases. Later, we will be able to show that the true volume is 48(fairly close to the approximation using boxes)
Double Integration by Geometry
If we interpret the double integral as a volume, we can somtimes evalutate these integrals using geometry.
Example
If:
Evalutate:
