Definition: Function of 2 Variables f(x,y)
-
assigns every ordered pair in the domain of f
-
A unique number in the range of
An Example Multivariable Function
Volume of a Cylinder:
Filled out:
Contour Maps
Simple Python MatplotLib contour map:
import micropip
await micropip.install("numpy")
await micropip.install("matplotlib")

import matplotlib.pyplot as plt
import numpy as np
from mpl_toolkits.mplot3d import Axes3D

# Create grid
x = np.linspace(-5, 5, 100)
y = np.linspace(-5, 5, 100)
x, y = np.meshgrid(x, y)

# Bowl shape (z = x^2 + y^2)
z = x**2 + y**2

# Create figure
fig = plt.figure()
ax = fig.add_subplot(111, projection="3d")

# Plot contour map
contour = ax.contour(x, y, z, levels=[5, 10, 15, 20, 25], cmap="viridis", extend3d=True)
ax.clabel(contour, inline=True, fontsize=10)

# Set labels
ax.set_xlabel("X")
ax.set_ylabel("Y")
ax.set_zlabel("Z")

# Add title
ax.set_title("3D Contour Map of Bowl Shape")

# Show plot
plt.show()
Now, projecting this onto a 2d plane:
import micropip
await micropip.install("numpy")
await micropip.install("matplotlib")

import matplotlib.pyplot as plt
import numpy as np

# Create grid
x = np.linspace(-5, 5, 100)
y = np.linspace(-5, 5, 100)
x, y = np.meshgrid(x, y)

# Bowl shape (z = x^2 + y^2)
z = x**2 + y**2

# Create figure
fig, ax = plt.subplots()

# Plot 2D contour map with specified levels
contour = ax.contour(x, y, z, levels=[5, 10, 15, 20, 25], cmap='viridis')

# Label contours
ax.clabel(contour, inline=True, fontsize=10)

# Set labels
ax.set_xlabel('X')
ax.set_ylabel('Y')

# Add title
ax.set_title('2D Contour Map of Bowl Shape')

# Show plot
plt.show()
You might notice that the “tighter” the contours, the “steeper” the surface.
How do you go back and forth between the projection and the 3d graph?
2D Vs. 3D Contour Maps: Projection and Lifting
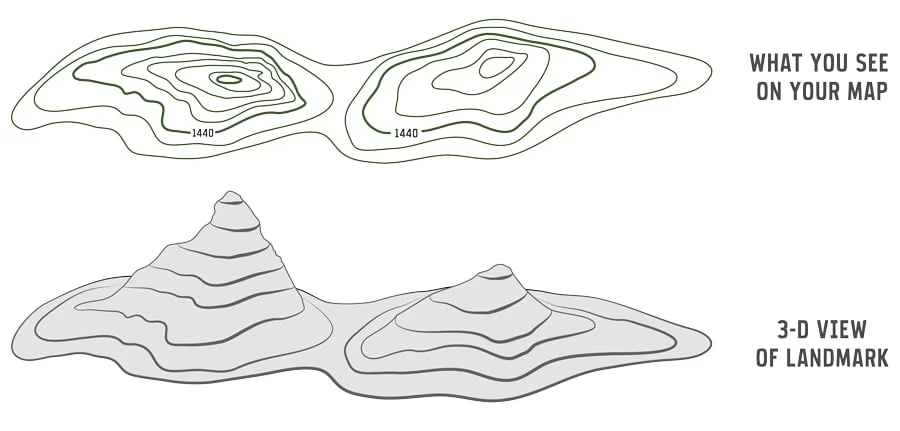
In a 3D contour map, we’re “lifting” the contours off the surface, giving each curve a specific height (or z value). Imagine slowly pulling up a flexible surface to see its shape in space. Each contour line represents a different height level, like a slice of the shape.
When we “squish” this back down into a 2D contour map, we flatten the surface while still showing where those height changes occur. The heights aren’t lost, but represented through lines on the flat plane, much like a topographical map of terrain. Each line corresponds to a different elevation, giving us a view of the shape without the 3D depth.
NOTE
This is similar to how topographical maps show mountains and valleys. Instead of showing peaks, we use contour lines to indicate changes in elevation.
Example
Let’s make a contour map for the following equation:
In the plane :
Plotting this with MatPlotLib yields:
import micropip
await micropip.install("numpy")
await micropip.install("matplotlib")

import numpy as np
import matplotlib.pyplot as plt

# Create grid
x = np.linspace(-10, 10, 400)
y = np.linspace(-10, 10, 400)
x, y = np.meshgrid(x, y)

# Equation for z = 1: x^2 / 4 - y^2 / 9 = 1
z = (x**2 / 4) - (y**2 / 9)

# Create figure
fig, ax = plt.subplots()

# Plot the contour where z = 1
contour = ax.contour(x, y, z, levels=[1], colors="blue")

# plot the contour where z = 2
contour = ax.contour(x, y, z, levels=[2], colors="red")

# Plot the contour where z = 3
contour = ax.contour(x, y, z, levels=[3], colors="green")

# Label contours
ax.clabel(contour, inline=True, fontsize=10)

# Set labels
ax.set_xlabel("X")
ax.set_ylabel("Y")

# Add title
ax.set_title(r"Contour map for $\frac{x^2}{4} - \frac{y^2}{9} = 1$")

# Show plot
plt.show()
Contour Density and Steepness
In a contour map, the spacing between lines reveals the steepness of the surface. When the contours are far apart, the elevation is changing gradually. But when the contours get closer together, the surface becomes steeper, showing a rapid change in elevation.
In the case of the hyperbolic contour map for , as the contours tighten around certain regions, it indicates that the surface is becoming much steeper there. This is similar to how, on a topographical map, closely packed lines represent a sharp incline on a mountain.
NOTE
The tighter the contours, the faster the change in height, just like on steep slopes in nature!
e^
